Yield and process engineers
Find the tool behind the pattern
- Every wafer classified, not a weekly sample
- Likely cause with sources for each alert
- Ask follow-up questions in plain English
AI yield copilot for semiconductor fabs
Sentry reads every wafer map as it leaves the tool, notices when one tool keeps producing the same defect, and tells the engineer the likely cause, the lots at risk and what it costs.
Model scores are on the held-out validation lots. The test set is kept back for one final evaluation.
The problem
After test, every wafer gets a map of which dies passed and which failed. The shape of the failures points at the process step that caused it: a ring at the edge, a scratch, a cluster in the centre.
Those maps are checked by hand, in batches, or not at all. By the time someone notices that one tool keeps producing the same shape, it has already run more lots.
Sources: WM-811K (Wu, Jang and Chen, IEEE Transactions on Semiconductor Manufacturing, 2015). Wafer value is the demo's stated assumption.
Of the 172,950 labelled maps, 85% show no defect pattern. The few that matter are buried among them.
Edge rings, scratches, centre clusters and donuts each point at a different tool or process problem.
25 wafers at an assumed $20,000 each. Every lot a drifting tool runs before someone acts adds to it.
The copilot
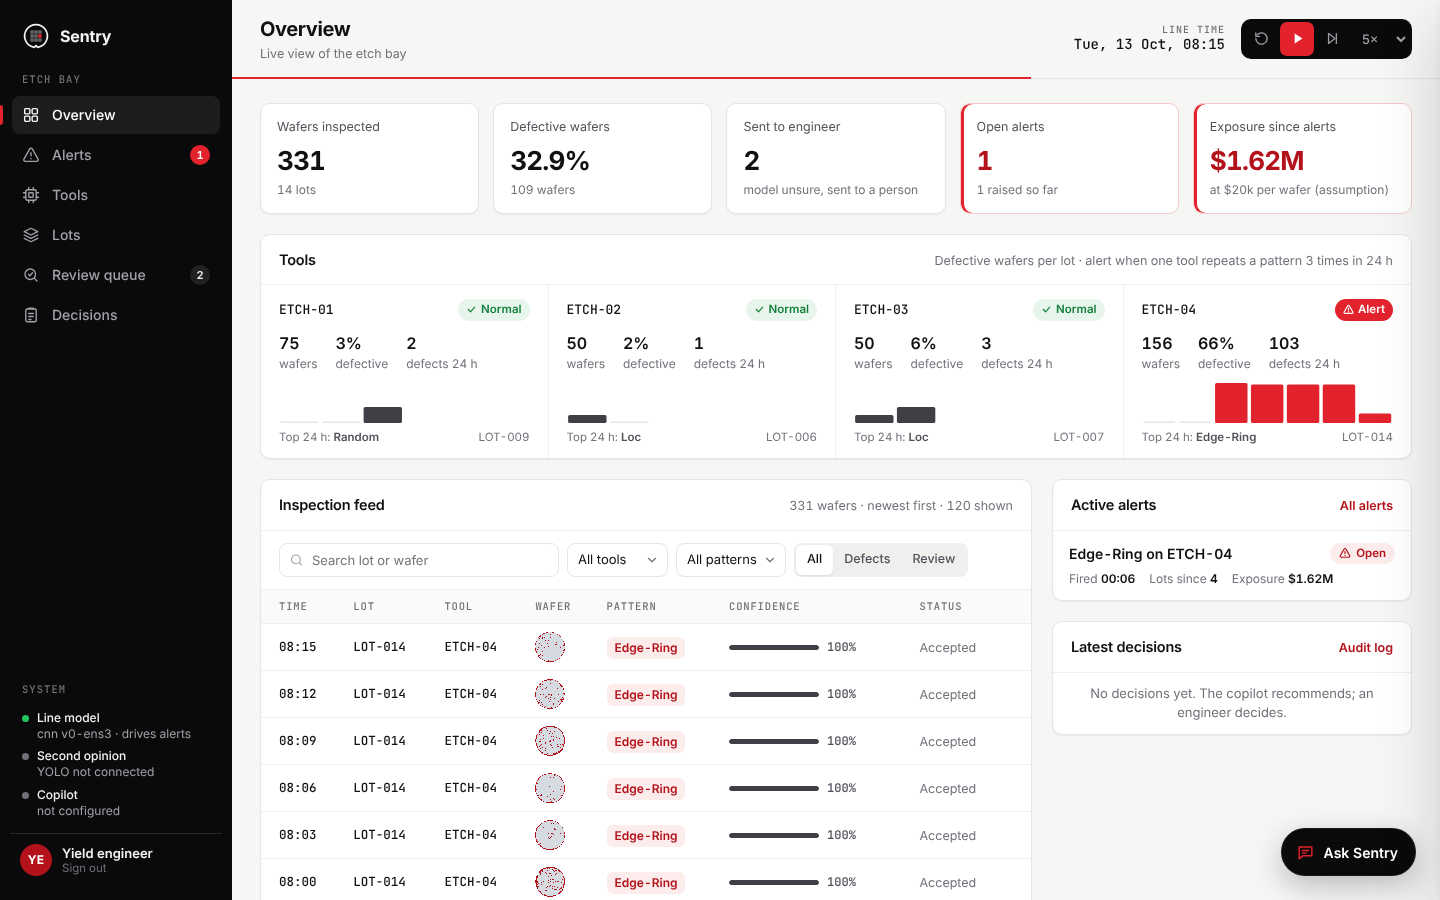
Every wafer is classified as it leaves the tool. When a pattern repeats on one tool, the copilot raises an alert, explains it and puts the decision in front of the engineer.
A calibrated CNN ensemble names the defect pattern in about 10 ms. When it is unsure, the wafer goes to a person instead of guessing.
An alert fires when one tool produces the same pattern three times within 24 hours.
An LLM copilot on AMD Token Factory pulls the lot history, likely root cause and cost, and cites where each answer came from.
Hold the lots, open a ticket or dismiss. Every decision is logged with the time and who made it.
3 wafers in 24 h · fired 00:06 in LOT-010



Likely cause · triage, not diagnosis
Edge temperature or plasma non-uniformity. Check focus and edge ring wear and edge etch-rate uniformity.
How it works
Three steps, each one you can inspect in the demo.








Each wafer map is read the moment it leaves the tool. The model sorts it into one of eight defect patterns or no pattern, and states how confident it is.

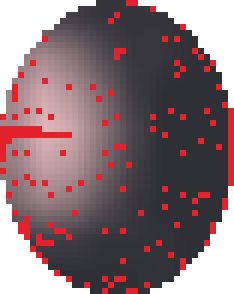
Every call can be opened: the map, the area that drove the decision, and the score for all nine patterns. Uncertain wafers are flagged for a person.
The engineer holds the lots, opens a maintenance ticket or dismisses the alert. The copilot recommends; a person decides.
Measured honestly
A model can look perfect when wafers from the same lot end up in both training and testing. We split by lot, so every score below comes from lots the model never trained on.
Who it's for
Yield and process engineers
Fab and shift managers
The demo replays 500 real wafers through four etch tools. Press play and watch ETCH-04 drift.